The Out-Sized Business Cost of Slow App Builds

Long build times for software applications can be a significant business cost. Every minute that software developers spend waiting for the software to build is almost* pure waste. When this is multiplied across a number of developers, each running a number of builds per day, it quickly adds up.
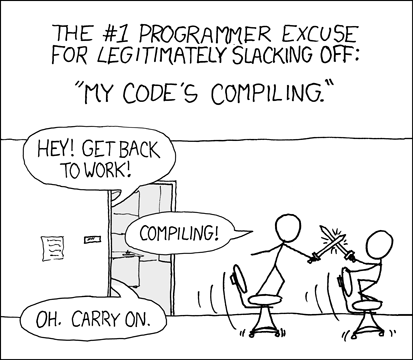
Obligatory XKCD

Credit: XKCD

To make this cost more tangible, imagine an enterprise mobile app that takes 5 minutes to build. Let’s assume that there are five mobile developers in the team running an average of 24 builds per day – that’s 4 builds per hour* over 6 hours of coding time in a day. This works out to 10 hours wasted each day.

This means that if developers are paid $100/hour, a five minute build translates to $1000 per day wasted, or $5000 a week.

This is more than the cost of hiring another developer(!)

It seems likely that this cost is under-appreciated by managers. The activity of building the app is mostly invisible to them. Kicking off and waiting for builds is something developers do, most of the time.*

Since slow builds are also an opportunity for significant cost savings, this lack of visibility isn’t a good thing. If their impact is hidden from management, it’s less likely that improvement work will be prioritised, and these savings will go unrealised.

To make matters worse, there are good reasons to think that the costs (and potential savings) of slow builds are much higher than the basic calculation above suggests.

Second order effects

Earlier we assumed that one minute of build time equals one minute of lost productivity – in other words, a linear relationship. This would mean that developers become 100% productive again as soon as a build finishes, regardless of how long they spent waiting.

In reality, this is probably a gross underestimate because it ignores second-order effects. For example, most developers would probably agree that the longer they spend waiting for a build, the longer it takes to get back into a fully productive state again. The real relationship between build time and lost productivity is likely to be nonlinear – i.e. not a straight line.

Investigation

Could a more solid case be made for this theory? – that business costs increase nonlinearly with average build time?

Investigating this possibility turned up a study from Parnin and Rugaber (2010) from the Georgia Institute of Technology. They found that after a programmer is interrupted, it takes an average of 10-15 minutes for them to start editing code again. If build times past a certain length represent a kind of “interruption” (or lead to other kinds of self-interruptions) this would straight away make their cost nonlinear.

The question then becomes: how long does a build need to take before it can be considered an interruption? For example, how long before the developer’s mind starts to wander and they’re no longer in a flow state (or anything close to it)?

As a starting point we could agree that once the developer switches to another task, such as checking email or social media, they are most definitely “interrupted”.* To get a rough idea of how long it takes for this kind of thing to happen, I ran the following (very rigorous) straw poll:

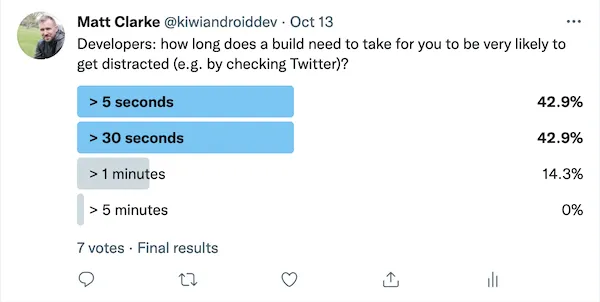
The results suggest it doesn’t take long at all. 85% of the people that responded said they are very likely to distract themselves if a build takes anywhere between 5 seconds to a minute.*

If this result is combined with the findings of a 10-15 minute cost of interruptions, a grim picture starts to emerge. Once build times exceed a certain length, their cost would jump way up.

Attempt at an improved cost model

Let’s model this with some real numbers to get a clearer picture.

We’ll call the time it takes some random developer to get distracted while waiting for a build their distraction threshold. Going by the straw poll, the distribution of these across the population of developers looks to be right-skewed. That is, most developers get distracted quite quickly, with the number quickly dwindling off from there to form a right-hand tail. By the 5 minute mark, 100% of developers are distracted.

The distraction thresholds of 10,000 random developers might look like this:

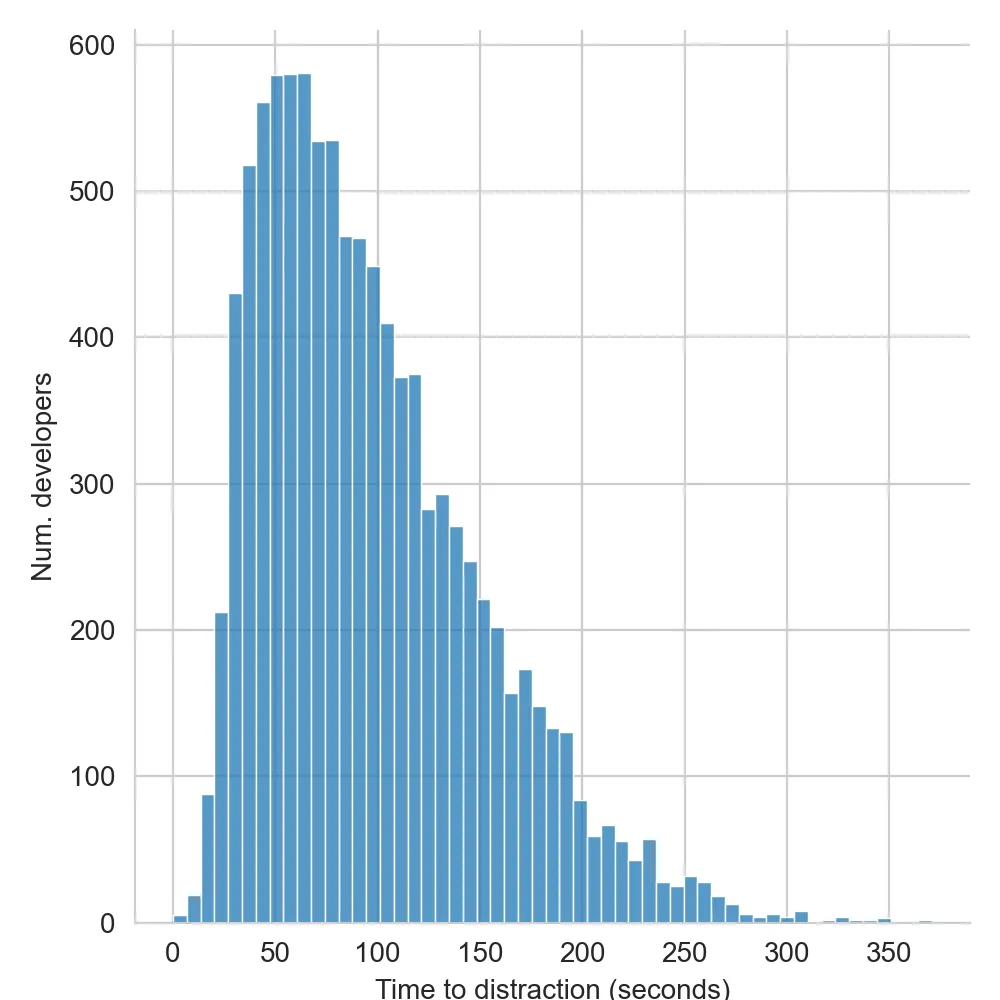
Now let’s work out how this could impact the productivity cost of build times.

To do this, let’s take the 1000 randomly generated developers from above. Then for a selection of different build times, work out the productivity cost incurred by each of them. That is, the total amount of time it takes from starting a build to being back in a productive state.

If the build time falls under the distraction threshold for a developer, we’ll assume that the productivity cost is simply the time spent waiting for the build.

However, if the build time goes above the distraction threshold, we’ll add an interruption cost on top of this. To model this extra cost we can use the findings from Parnin and Rugaber (2010). Their results on the time it takes a developer to start editing code again after resuming from an interruption (from 1,213 programming sessions) were:

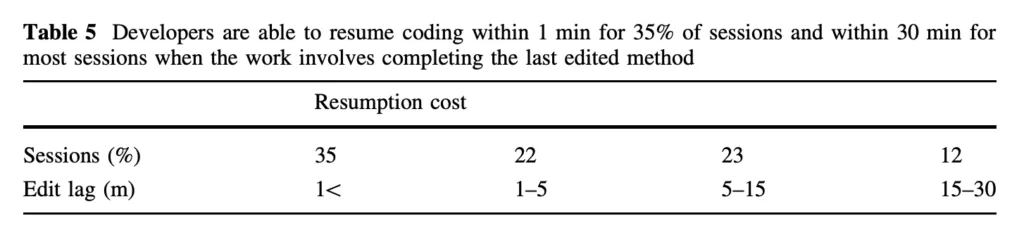
Based on this table there’s a 35% chance of the interruption cost being less than one minute, and a 22% chance of it being between one and five minutes, etc.

Note that the percentages don’t add up to 100%. There’s a missing column for the 8% of sessions where the edit lag was 30-360(!) minutes.

Raw results

Running the simulation for each of the 1000 developers, and for every build duration between 0 and 5 minutes (in half second increments – e.g. 0, 0.5, 1, 1.5 seconds…), gave these results:

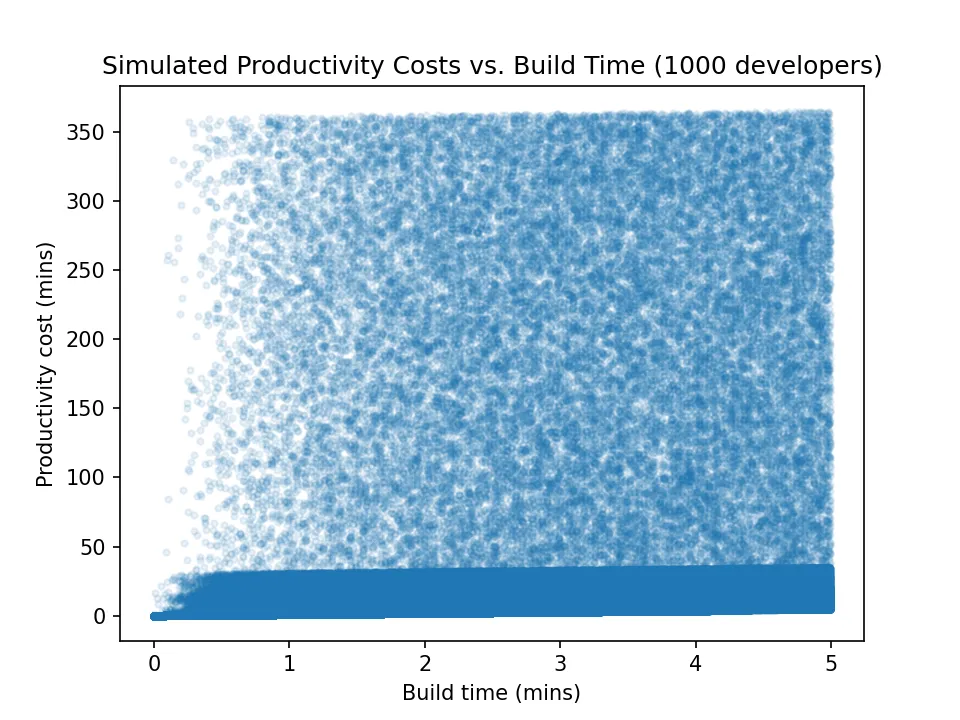
This plot is difficult to make much sense of at a glance. Most of the plot area looks to be dominated by random noise. This large noisy area is the developers incurring the full interruption cost of 30-360 minutes.

However on closer inspection, it does look this full interruption cost occurs less often in the 0-1 minute build time range – the points aren’t so dense here. This is what we would expect given the distraction threshold distribution.

Reassuringly, the high density of points falling between the 0-30 minute cost range (i.e. the solid blue band) also implies that most of the costs fall in this range.

Averaged results

Rather than plotting the raw data, we can get a clearer picture of what’s going on by only looking at the average cost incurred at each possible build time. This way we’ll have only one point to plot for each half-second, rather than 1000.

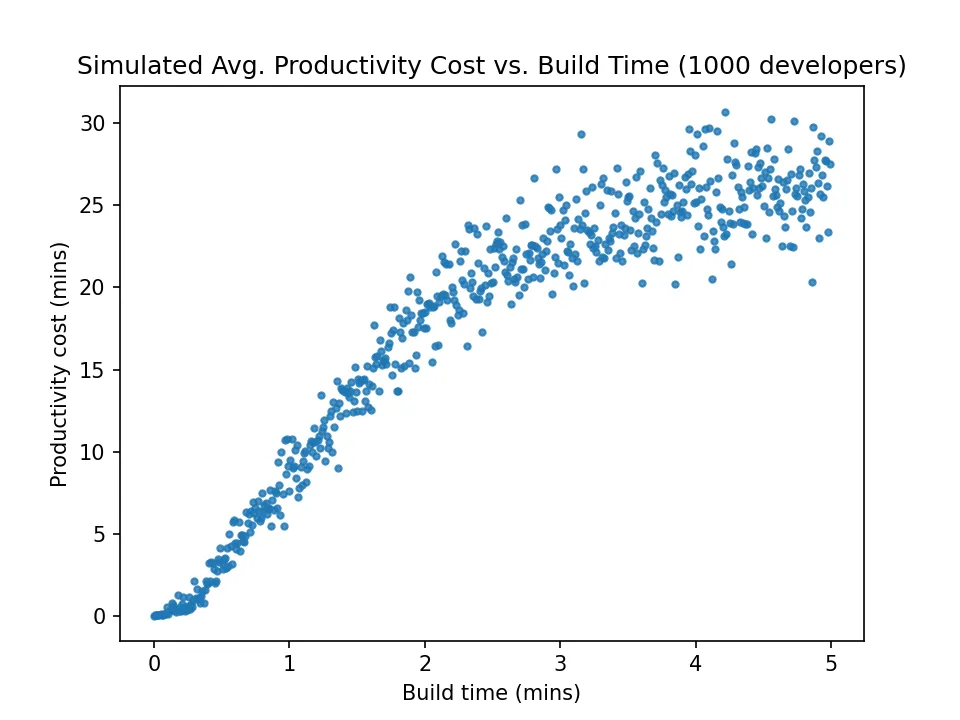
Now it’s much easier to make out a curve in the relationship between productivity cost and build time. This is even clearer if a regression line is fitted to the data:

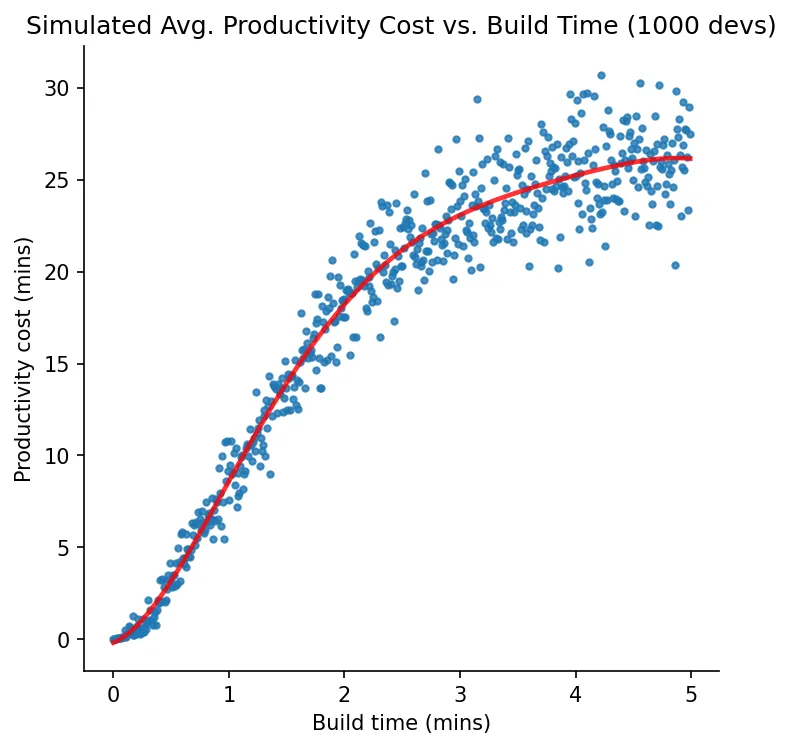
The curve appears to be S-shaped: relatively shallow and linear between 0-15 seconds, rapidly curving upwards after that, and only levelling off again around the 4 minute build time mark. The cost increases are fastest for builds about 15 seconds to 2 minutes long.

We can also see that the productivity cost becomes more variable (less predictable) as build time increases.

Business Implications

What would some of the business implications of this nonlinear relationship be? What can you take away from this if you’re managing or participating in a software development team?

On one hand, it means that slow builds probably cost a lot more than you would expect. Rather than one minute of build time equally roughly one minute of lost productivity, the real cost could be up to 8 minutes per minute of build in the worst case (the steepest part of the curve on the graph above).

The good news is that the potential cost savings are also a lot higher than you might expect. This is particularly true if the software’s build time is in the “danger zone” for developers becoming distracted – say between 30 seconds to 2 minutes long. Any investment into reducing the build time here should give disproportionate returns.

To illustrate this, assume a company’s app takes 2 minutes to build. If management decides to invest 6 developer-hours into improving the build time, and this succeeds in reducing it by only 10 seconds, this ends up saving roughly 4 minutes of productive time per build.

Plugging in some assumptions from earlier (5 developers in a team, running 24 builds a day, $100 per dev hour), this 4 minute build time saving equates to 8 developer-hours a day, or $4000 a week.

A weekly return of $4000 on a one-off investment of $600 is favorable by any measure.

It should be pointed out that builds times over the average distraction threshold (say more than 5 minutes) are likely to always incur the full interruption cost. In this zone, small improvements to the build time won’t give the same return on investment.

Via Negativa

Investment in improving build times might be attractive to product managers for another reason. Compared to other potential development tasks, it’s a low risk activity. Improving build times is generally less likely to cause unintended consequences to users compared to feature development or bug fixing work.

New feature work, while necessary to keep the product useful and competitive, can sometimes fail to pay for itself. Sometimes a new feature just falls flat with users, or even gets a negative reaction. In any case it will make the software more complex and costly to maintain.

Bug fixing work is lower-risk. But it still means changing the software’s source code, which can introduce new bugs.

Improving the build speed is relatively safer because there are many ways of doing it without changing the software’s source code. Perhaps the most obvious example of this is simply to buy faster machines. Users get the same software, it’s just built faster.

While it is true that optimizing build times can also introduce bugs, this is more true for aggressive optimizations. It’s less true for the kind of easy wins that can be gained if the build process has been a neglected area of investment.

Note that this is an example of “Via Negativa” – improvement by subtraction of the undesirable, as opposed to improvement by addition of the (assumed-to-be) desirable. Improving things by removing what’s bad is lower-risk because, as Nassim Taleb says: “we know a lot more about what is wrong than what is right.”

Limitations and Future Research

As the saying goes: “All models are wrong. Some are useful“.

With that in mind, here are some of the known ways in which this model is a simplification. These also point the way towards how further research could be done to build a more accurate model.

  • The distraction threshold distribution was modelled on a survey response from 7 (probably Android) developers. Ideally a much larger sample would be used, with the distraction threshold inferred not from self-reports, but from (e.g.) analytics data from developer tools. Jetbrains could probably build a much more accurate picture from their IDE usage data.
  • The model assumes that each developer has a single, unchanging distraction threshold. In reality, a developer’s distraction threshold could vary over time for any number of reasons. For example, research suggests that we’re less productive (and more distractible?) near the end of the week, after lunchtime and during winter.
  • It’s assumed that developers attempt to resume their task as soon as the build finishes. In reality, it’s possible that they don’t return to development right away, but continue with the other task for a while. For example, they might finish reading the email they’re looking at first. Taking this into account would add to the interruption cost, making the current cost model a conservative estimate.

Note that there will be unknown limitations on top of these. If you notice any errors or important limitations I’ve left out, please drop me a comment below.

Conclusion

Slow build times can be a significant business expense when added up across a number of developers running multiple builds per day. If second-order effects are considered, such as the findings on interruption costs by Parnin and Rugaber (2010), the costs are greater still.

The upside of this nonlinearity is that it cuts both ways – there are significant cost savings to be had by even modest improvements to average build times. This is particularly the case when the current build time is hovering around the typical developer’s “distraction threshold” – the amount of time they wait before they’re likely to switch to another task. A straw poll indicated this could be somewhere between 5 seconds to 1 minute, however further research is needed to get a reliable estimate for this.

Thanks to Cristina and Dennis for reviewing a draft of this post.


Footnotes

  1. “Almost” because it’s not as though developers’ brains shut off completely while waiting for a build to finish. Assuming they don’t switch to another task, it’s reasonable to assume they’ll continuing mentally working on the task, to the degree this is possible. However, I’ve left this out of consideration to simply things.
  2. Note that an industry best practise for building quality software, called Test-Driven Development (TDD), prescribes rebuilding and retesting after every small change. This could be every few minutes. Therefore the cost of slow builds will be even higher for teams practising TDD. On the other hand, this should be mitigated by incremental builds, to the degree they’re supported.
  3. QAs, Product Owners and other stakeholders wanting the latest app version might also start builds, or at least have to wait for them. Given that this is likely to be negligible compared with the number of builds run by developers (and to keep things simple) I’ve left this out of consideration.
  4. Interestingly, this study from the University of Calgary found that self-interruptions (i.e. voluntary task switching) are even more disruptive than external interruptions, and also result in more errors.
  5. Another avenue for further research: it seems likely that the expected build time is a factor in the developer’s decision of what kind of task to switch to while they’re waiting, if they do switch tasks. E.g. if a developer knows ahead of time that the build is likely to take 10 minutes, perhaps they are more likely to visit the kitchen for a snack versus an expected build time of 10 seconds. Another nonlinearity.

Forcing Functions in Software Development

Here’s an unavoidable fact: the software project you’re working on has some flaws that no one knows about. Not you, your users, nor anyone in your team. These could be anything from faulty assumptions in the UI to leaky abstractions in the architecture or an error-prone release process.

Given enough time, these flaws will be discovered. But time is money. The sooner you discover them, the cheaper they are to fix. So how do you find out about them sooner?

The good news is that there are some things you can do to force issues up to the surface. You might already be doing some of them.

Here are some examples:

  • Dig out an old or cheap phone and try to run your app on it. Any major performance bottlenecks will suddenly become obvious
  • Pretend you’re a new developer in the team1. Delete the project from your development machine, clone the source code and set it up from scratch. Gaps in the Readme file and outdated setup scripts will soon become obvious
  • Try to add support for a completely different database. Details of your current database that have leaked into your data layer abstractions will soon become obvious
  • Port a few screens from your front-end app to a different platform. For example, write a command-line interface that reuses the business and data layers untouched. “Platform-agnostic” parts of the architecture might soon be shown up as anything-but
  • Start releasing beta versions of your mobile app every week. The painful parts of your monthly release process will start to become less painful
  • Put your software into the hands of a real user without telling them how to use it. Then carefully watch how they actually use it

To borrow a term from interaction design, these are all examples of Forcing Functions. They raise hidden problems up to consciousness in such a way that they are difficult to ignore and therefore likely to be fixed.

Of course, the same is true of having an issue show up in production or during a live demo. The difference is that Forcing Functions are applied voluntarily. It’s less stressful, not to mention cheaper, to find out about problems on your own terms.

If your Android app runs smoothly on this, it’ll run smoothly on anything.

If you imagine your software as something evolving over time, strategically applying forcing functions is a way of accelerating this evolutionary process.

Are there any risks in doing this? A forcing function is like an intensive training environment. And while training is important, it’s not quite the real world (“The Map Is Not the Territory“). Forcing functions typically take one criteria for success and intensify it in order to force an adaptation. Since they focus on one criteria and ignore everything else, there’s a risk of investing too much on optimizing for that one thing at the expense of the bigger picture.

In other words, you don’t want to spend months getting your mobile game to run buttery-smooth on a 7 year old phone only to find out that no one finds the game fun and you’ve run out of money.

Forcing functions are a tool; knowing which of them to apply in your team and how often to apply them is a topic for another time.

However, to give a partial answer: I have a feeling that regular in-person tests with potential customers might be the ultimate forcing function. Why? Not only do they unearth a wealth of unexpected issues like nothing else, they also give you an idea of which other forcing functions you might want to apply. They’re like a “forcing function for forcing functions”.

Or to quote Paul Graham:

The only way to make something customers want is to get a prototype in front of them and refine it based on their reactions.

Paul Graham – How to Start a Startup

If you found this article useful, please drop me a comment or consider sharing it with your friends and colleagues using one of the buttons below – Matt (@kiwiandroiddev)


1 Thanks to Alix for this example. New starters have a way of unearthing problems not only in project setup, but in the architecture, product design and onboarding process at your company, to give a few examples.

Cover Photo by Victor Freitas on Unsplash

What percentage of your users use your app daily?

Both the Developer Console and Google Analytics can display your app’s active users the number of users that opened your app at least once on each day. Knowing the number of active users is a good start to getting an idea of user engagement, but the problem with looking at it in isolation is that it doesn’t give you any idea of how many of your users have your app installed and don’t open it at all each day.

What’s needed is a new metric with more context – the number of active daily users as a percentage of total users. This is a more accurate indicator of the actual value your app is offering your users, and can be used to validate that specific changes to your app are actually making it more useful or enjoyable (in Lean Startup terms, it is more a core metric and less of a vanity metric).

How to measure daily active users as a percentage for your Android app

You will need:

  • an Android app with Google Analytics and a reasonable amount of analytics data
  • Excel, LibreOffice Calc or an equivalent spreadsheet program for plotting graphs

Note: the sample screenshots I’ve included here use data from my recently released RadioDrive app.

  1. Go to Google Play Developer Console, select your app, go to Statistics.
  2. Select Current Installs by User (this accounts for users that have your app installed on more than one of their devices, unlike Current Installs by Device).
  3. Select 1 year for the time range so you get everything.
  4. Click Export to CSV. In the dialog make sure only the Users -> Current checkbox is selected.

Now we want to get hold of data for the number of active users. The Play Developer Console does have this statistic, but unfortunately you can’t currently export the data. Onward to Google Analytics…

  1. Login to Google Analytics, select “All Mobile App Data” for your app.
  2. Click Active Users from your App Overview page.

  1. Adjust the date range (drop-down box in the top-right corner) if necessary, then click Export > CSV

  1. The next step is to import and combine both datasets in Excel. Once you have copied both sets of data into the same spreadsheet, you’ll want to sort the Developer Console data by increasing date so it matches the Analytics data. To do this in Calc, box-select all rows for the date and current_user_install columns, then select Data -> Sort -> Sort by ascending date.

  1. Move active user data so the dates correspond, if necessary…

  1. Make a new column for percentage (Formula: =(C6/B6)*100). You can delete the Day Index column now as it’s redundant.

  1. Plot a line graph (date on X axis, percent on Y axis)

So far so good, we have a graph showing the percentage of active users each day.

But there’s a problem. Say you release an update for your app that is a total flop. Users start to uninstall your app in droves, except for a small segment of your dedicated fans. In this case, the percentage of active users may actually go up, as your botched update eliminates all but your most loyal users.

If you keep an eye on your other statistics such as daily uninstalls and number of active users (as well as monitoring actual user feedback), you would (hopefully) pick up this kind of scenario. However it’d be nice to be able to see this situation occurring in the same graph.

To do this, you can simply plot current user installs or number of active users on the same axes. That way, you’ll know something is up if either of them start trending downward.

Here I’ve plotted current user installs on a secondary Y axis:

The final graph (after adjusting the percentage scale to prevent overlap):

(In case you’re wondering, the lack of active user data until the 8th Dec is due to Google Analytics not being in the app until then!)

Extra credit: add a 3 or 5 day moving average trend line to % Active Users to smooth out fluctuations (having a larger sample size helps with this also).

What core metrics do you measure for your app and what tools do you use to measure them?

Google I/O 2013 – Cognitive Science and Design, and how it applies to Android apps

This is an excellent talk by Alex Faaborg at Google I/O 2013 about cognitive science principles and how they apply to interface design. Here’s a summary of some of the main points and how they could be used to improve your apps:

  • We can search for objects of the same colour much faster than searching for objects of the same shape [18:26]
  • We can scan a group of faces for one we recognise in parallel rather than sequentially. This could be taken advantage of in messaging and address book apps, for example [10:13]
  • Objects in our periphery are recognised much faster than in our frontal field (tiger example in the video). You can put a small notification icon in the corner of the screen away from the user’s focal point and it will still be noticed [6:50]
  • Colour-deficiency: you can get away with using green and red as long as the contrast is significantly different. Best approach is to test your interface with filtering tools to see how it would actually look (e.g. Photoshop) [13:50]
  • Our brains are very good at recognising patterns. It’s not necessary to group objects together in a box, just having whitespace between groups will do [3:24]
  • You’ll recognise a silhouette of an object that just shows its basic geometry faster than you will recognise a more photo-realistic depiction of the object. This principle is used in the Holo icon set [9:10]
  • Notifications/interruptions wipe the contents of our working memory and make us lose the state of “creative flow” if we were in it. Takeaway: use notifications carefully [22:22]
  • “Chunking” optimizes for our working memory. Examples are the groups of digits in credit card and phone numbers. Make sure your interface supports these chunks and ignores user-entered whitespace! [21:17]
  • We make trust decisions quickly and once made they are slow to change, even to the point of us explaining away new information that goes against them. First impressions matter – make sure you have a quality application icon [24:16]
  • You don’t *have* to be consistent with existing interfaces and interaction paradigms when designing your app. Combining innovation with teaching the user (e.g. with a quick example video) can work well. Example: collaborating on documents via email attachments vs. using Google Docs [31:21]

Android: 9 patching a family of images the easy way

9 patch images in Android are great but if you happen to have a family of graphics to convert, it can get pretty tedious. I had a collection of button graphics that needed converting to 9 patches using the same stretchable regions.

Rather than do it all by hand with Photoshop or GIMP (and inevitably need to redo them all again later when something needed changing) I wrote a small BASH script to do it.

To use the script, first use the draw9patch tool to create the 9 patch info for one of your graphics – this will become the template. Once you’re done, go:

[code language=”bash” light=”true”]
./9batch.sh template.9.png button2.png button3.png …
[/code]

to copy the 1 pixel border from the template to your remaining graphics and save a .9.png version of each of them.

Note that you’ll need to install ImageMagick to use the 9batch script:

[code language=”bash” light=”true”]
sudo apt-get install imagemagick
[/code]

Apparently WordPress won’t let me upload the script itself so here’s the source code:

[code language=”bash” light=”true” collapse=”true”]
#!/bin/bash

if [ "$#" -lt 2 ]; then
echo "Usage: 9batch.sh template image1 image2 …" >&2
echo
echo "Applies 9 patch info to a family of images using one image as the template" >&2
echo "Template image should be 2 pixels wider and higher than source images" >&2
exit 1
fi

# 9 patch image to use as template
src=$1

for i in ${@:2}
do
# use sed to change extension from .png to .9.png and assign result to ‘out’
out=`echo $i | sed -e ‘s:\(….\)$:.9\1:’`
composite -gravity center $i $src $out
done
[/code]

Android Device Nudge Detection Helper Class

I recently added a feature to StarCraft 2 Build Player to start playing build orders when the users’ phone is nudged. The idea is so you don’t have to waste precious seconds looking down at your phone to tap the “Play” button, instead you can just mindlessly bump your phone on your desk and you’re off.

Anyway, it turned out to be pretty easy to factor this into a reusable class so here it is:

[sourcecode language=”java”]
package com.kiwiandroiddev.sc2buildassistant;

import java.util.ArrayList;

import android.content.Context;
import android.hardware.Sensor;
import android.hardware.SensorEvent;
import android.hardware.SensorEventListener;
import android.hardware.SensorManager;
import android.os.Handler;

/**
* Class for reporting when the device’s acceleration (excluding gravity) exceeds
* a certain value. Compatible with all Android versions as it uses Sensor.TYPE_ACCELEROMETER
* rather than Sensor.TYPE_LINEAR_ACCELERATION.
*
* NudgeDetector objects are initially disabled. To use, implement
* the NudgeDetectorEventListener interface in your class, then register it
* to a new NudgeDetector object with registerListener(). Finally, call
* setEnabled(true) to start detecting device movement. You should add a call
* to stopDetection() in your Activity’s onPause() method to conserve battery
* life.
*
* @author kiwiandroiddev
*
*/
public class NudgeDetector implements SensorEventListener {

private ArrayList<NudgeDetectorEventListener> mListeners;
private Context mContext;
private SensorManager mSensorManager;
private Sensor mAccelerometer;
private boolean mEnabled = false;
private boolean mCurrentlyDetecting = false;
private boolean mCurrentlyChecking = false;
private int mGraceTime = 1000; // milliseconds
private int mSampleRate = SensorManager.SENSOR_DELAY_GAME;
private double mDetectionThreshold = 0.5f; // ms^-2
private float[] mGravity = new float[] { 0.0f, 0.0f, 0.0f };
private float[] mLinearAcceleration = new float[] { 0.0f, 0.0f, 0.0f };

/**
* Client activities should implement this interface and register themselves using
* registerListener() to be alerted when a nudge has been detected
*/
public interface NudgeDetectorEventListener {
public void onNudgeDetected();
}

public NudgeDetector(Context context) {
mContext = context;
mListeners = new ArrayList<NudgeDetectorEventListener>();
mSensorManager = (SensorManager) mContext.getSystemService(Context.SENSOR_SERVICE);
mAccelerometer = mSensorManager.getDefaultSensor(Sensor.TYPE_ACCELEROMETER);
}

// Accessors follow

public void registerListener(NudgeDetectorEventListener newListener) {
mListeners.add(newListener);
}

public void removeListeners() {
mListeners.clear();
}

public void setEnabled(boolean enabled) {
if (!mEnabled && enabled) {
startDetection();
} else if (mEnabled && !enabled) {
stopDetection();
}
mEnabled = enabled;
}

public boolean isEnabled() {
return mEnabled;
}

/**
* Returns whether this detector is currently registered with the sensor manager
* and is receiving accelerometer readings from the device.
*/
public boolean isCurrentlyDetecting() {
return mCurrentlyDetecting;
}

/**
* Sets the the amount of acceleration needed to trigger a "nudge".
* Units are metres per second per second (ms^-2)
*/
public void setDetectionThreshold(double threshold) {
mDetectionThreshold = threshold;
}

public double getDetectionThreshold() {
return mDetectionThreshold;
}

/**
* Sets the minimum amount of time between when startDetection() is called
* and nudges are actually detected. This should be non-zero to avoid
* false positives straight after enabling detection (e.g. at least 500ms)
*
* @param milliseconds_delay
*/
public void setGraceTime(int milliseconds_delay) {
mGraceTime = milliseconds_delay;
}

public int getGraceTime() {
return mGraceTime;
}

/**
* Sets how often accelerometer readings are received. Affects the accuracy of
* nudge detection. A new sample rate won’t take effect until stopDetection()
* then startDetection() is called.
*
* @param rate must be one of SensorManager.SENSOR_DELAY_UI,
* SensorManager.SENSOR_DELAY_NORMAL, SensorManager.SENSOR_DELAY_GAME,
* SensorManager.SENSOR_DELAY_FASTEST
*/
public void setSampleRate(int rate) {
mSampleRate = rate;
}

public int getSampleRate() {
return mSampleRate;
}

/**
* Starts listening for device movement
* after an initial delay specified by grace time attribute –
* change this using setGraceTime().
* Client Activities might want to call this in their onResume() method.
*
* The actual sensor code uses a moving average to remove the
* gravity component from acceleration. This is why readings
* are collected and not checked during the grace time
*/
public void startDetection() {
if (mEnabled && !mCurrentlyDetecting) {
mCurrentlyDetecting = true;
mSensorManager.registerListener(this, mAccelerometer, mSampleRate);

Handler myHandler = new Handler();
myHandler.postDelayed(new Runnable() {
@Override
public void run() {
if (mEnabled && mCurrentlyDetecting) {
mCurrentlyChecking = true;
}
}
}, mGraceTime);
}
}

/**
* Deregisters accelerometer sensor from the sensor manager.
* Does nothing if nudge detector is currently disabled.
* Client Activities should call this in their onPause() method.
*/
public void stopDetection() {
if (mEnabled && mCurrentlyDetecting) {
mSensorManager.unregisterListener(this);
mCurrentlyDetecting = false;
mCurrentlyChecking = false;
}
}

// SensorEventListener callbacks follow

@Override
public void onAccuracyChanged(Sensor sensor, int accuracy) {
}

@Override
public void onSensorChanged(SensorEvent event) {
// alpha is calculated as t / (t + dT)
// with t, the low-pass filter’s time-constant
// and dT, the event delivery rate

final float alpha = 0.8f;

mGravity[0] = alpha * mGravity[0] + (1 – alpha) * event.values[0];
mGravity[1] = alpha * mGravity[1] + (1 – alpha) * event.values[1];
mGravity[2] = alpha * mGravity[2] + (1 – alpha) * event.values[2];

mLinearAcceleration[0] = event.values[0] – mGravity[0];
mLinearAcceleration[1] = event.values[1] – mGravity[1];
mLinearAcceleration[2] = event.values[2] – mGravity[2];

// find length of linear acceleration vector
double scalarAcceleration = mLinearAcceleration[0] * mLinearAcceleration[0]
+ mLinearAcceleration[1] * mLinearAcceleration[1]
+ mLinearAcceleration[2] * mLinearAcceleration[2];
scalarAcceleration = Math.sqrt(scalarAcceleration);

if (mCurrentlyChecking && scalarAcceleration >= mDetectionThreshold) {
for (NudgeDetectorEventListener listener : mListeners)
listener.onNudgeDetected();
}
}
}

[/sourcecode]

The reason I stuck to using Sensor.TYPE_ACCELEROMETER was because I want to support Froyo with my app. If you’re only targeting 2.3 (API level 9) and higher, you could use Sensor.TYPE_LINEAR_ACCELERATION, and simplify this code a fair bit by stripping out the gravity calculation in onSensorChanged(), etc.

Feel free to use this in your projects. Drop me a comment if you spot bugs or have any suggestions.

Data on Android device supported features

I’ve recently been experimenting with OpenGL ES 2.0 on Android for a graphical app (some excellent guides can be found at http://www.learnopengles.com/). So far so good. It turns out that gone are the days of countless fixed function calls like glBegin() glVertex3f() glColor4f() for sending vertex data, nowadays you use shaders for everything and send your vertex data to OpenGL in large chunks.  Supposedly this makes the graphics driver software a lot simpler to write and leads to better performance overall. Keeping track of all of those calls and their corresponding closing calls could end up a bit of a headache so it seems like it provides some benefit to application developers too.

Before diving in and using ES 2.0 exclusively (well, at first anyway – code for ES 1.x support can always be added later) I wanted to get an idea of how widely ES 2.0 is supported across Android devices because it could have a big effect on the market size for my app.

After filtering through some anecdotal evidence on Stackoverflow, not surprisingly the best place to find this data was straight from the horse’s mouth at the Android Dashboards page.

According to the data, ES 2.0 support is over 90% and it seems reasonable to assume it’s only going to increase in time. So that settles it – OpenGL ES 2.0 it is.

The Dashboards page also has data on the installation base for each Android version which may also be very useful to you during the research phase of developing your app.