Both the Developer Console and Google Analytics can display your app’s active users – the number of users that opened your app at least once on each day. Knowing the number of active users is a good start to getting an idea of user engagement, but the problem with looking at it in isolation is that it doesn’t give you any idea of how many of your users have your app installed and don’t open it at all each day.
What’s needed is a new metric with more context – the number of active daily users as a percentage of total users. This is a more accurate indicator of the actual value your app is offering your users, and can be used to validate that specific changes to your app are actually making it more useful or enjoyable (in Lean Startup terms, it is more a core metric and less of a vanity metric).
How to measure daily active users as a percentage for your Android app
You will need:
- an Android app with Google Analytics and a reasonable amount of analytics data
- Excel, LibreOffice Calc or an equivalent spreadsheet program for plotting graphs
Note: the sample screenshots I’ve included here use data from my recently released RadioDrive app.
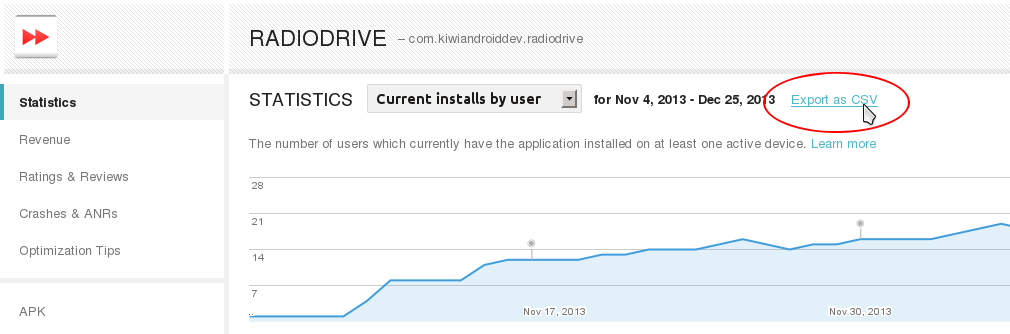
- Go to Google Play Developer Console, select your app, go to Statistics.
- Select Current Installs by User (this accounts for users that have your app installed on more than one of their devices, unlike Current Installs by Device).
- Select 1 year for the time range so you get everything.
- Click Export to CSV. In the dialog make sure only the Users -> Current checkbox is selected.
Now we want to get hold of data for the number of active users. The Play Developer Console does have this statistic, but unfortunately you can’t currently export the data. Onward to Google Analytics…
- Login to Google Analytics, select “All Mobile App Data” for your app.
- Click Active Users from your App Overview page.
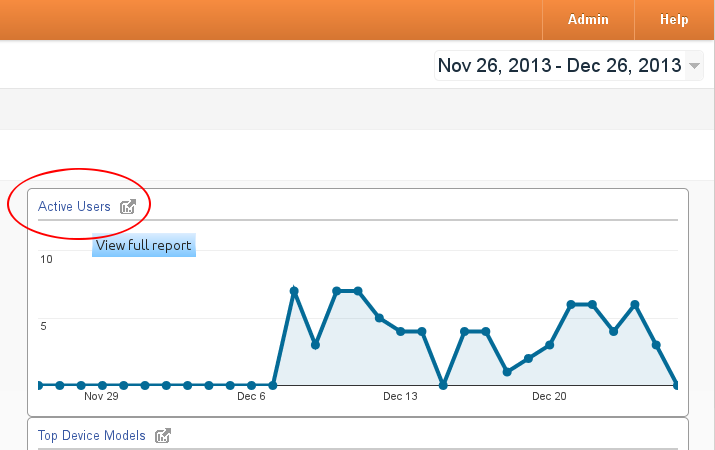
- Adjust the date range (drop-down box in the top-right corner) if necessary, then click Export > CSV

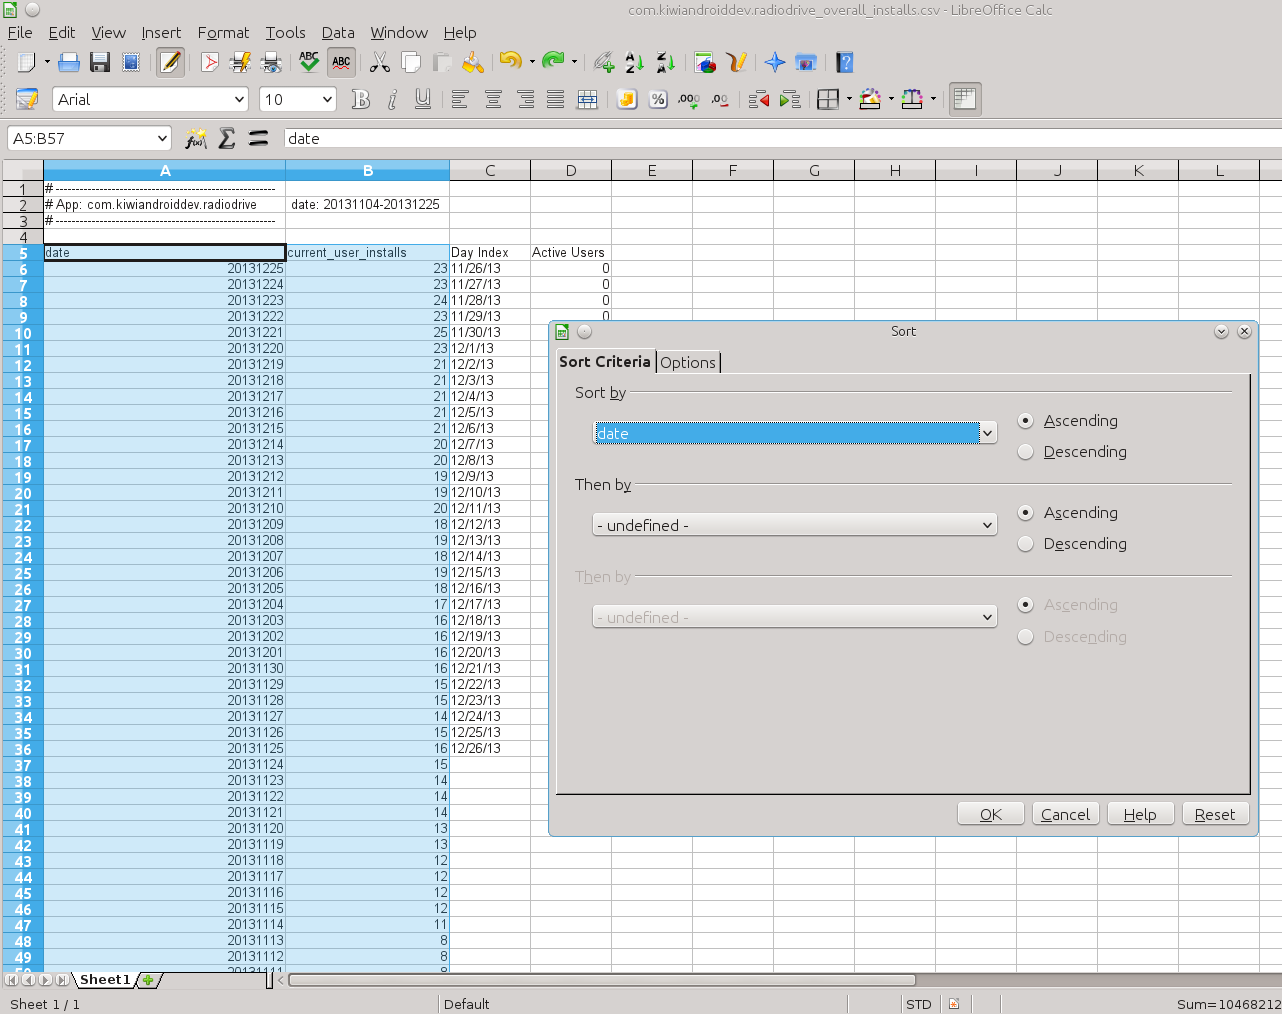
- The next step is to import and combine both datasets in Excel. Once you have copied both sets of data into the same spreadsheet, you’ll want to sort the Developer Console data by increasing date so it matches the Analytics data. To do this in Calc, box-select all rows for the date and current_user_install columns, then select Data -> Sort -> Sort by ascending date.
- Move active user data so the dates correspond, if necessary…
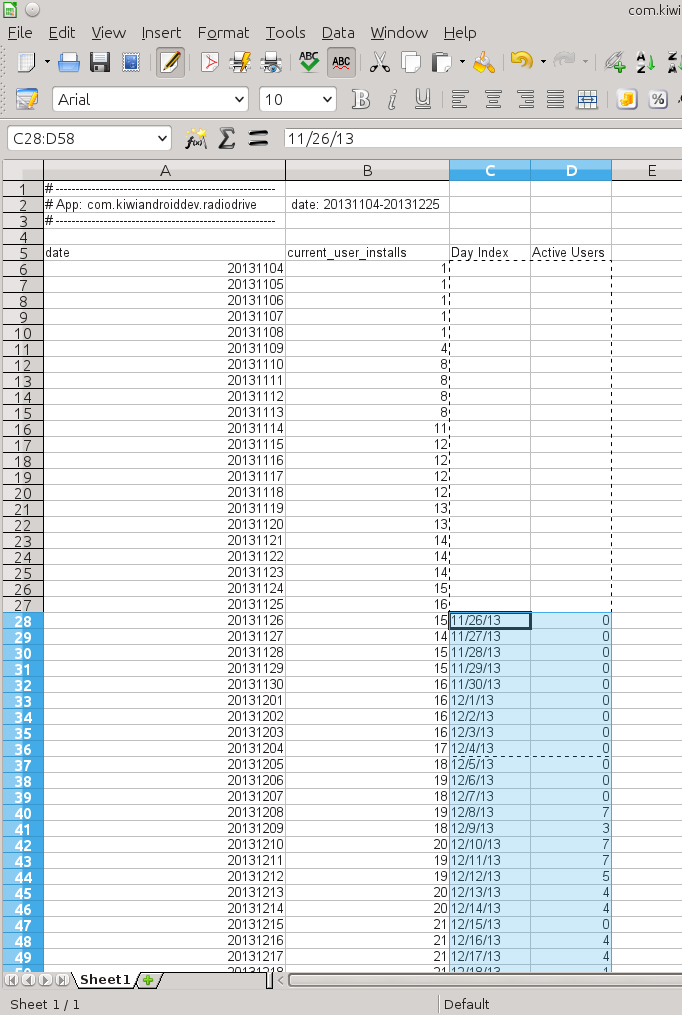
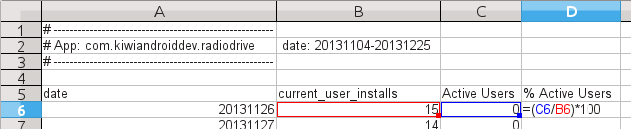
- Make a new column for percentage (Formula: =(C6/B6)*100). You can delete the Day Index column now as it’s redundant.
- Plot a line graph (date on X axis, percent on Y axis)
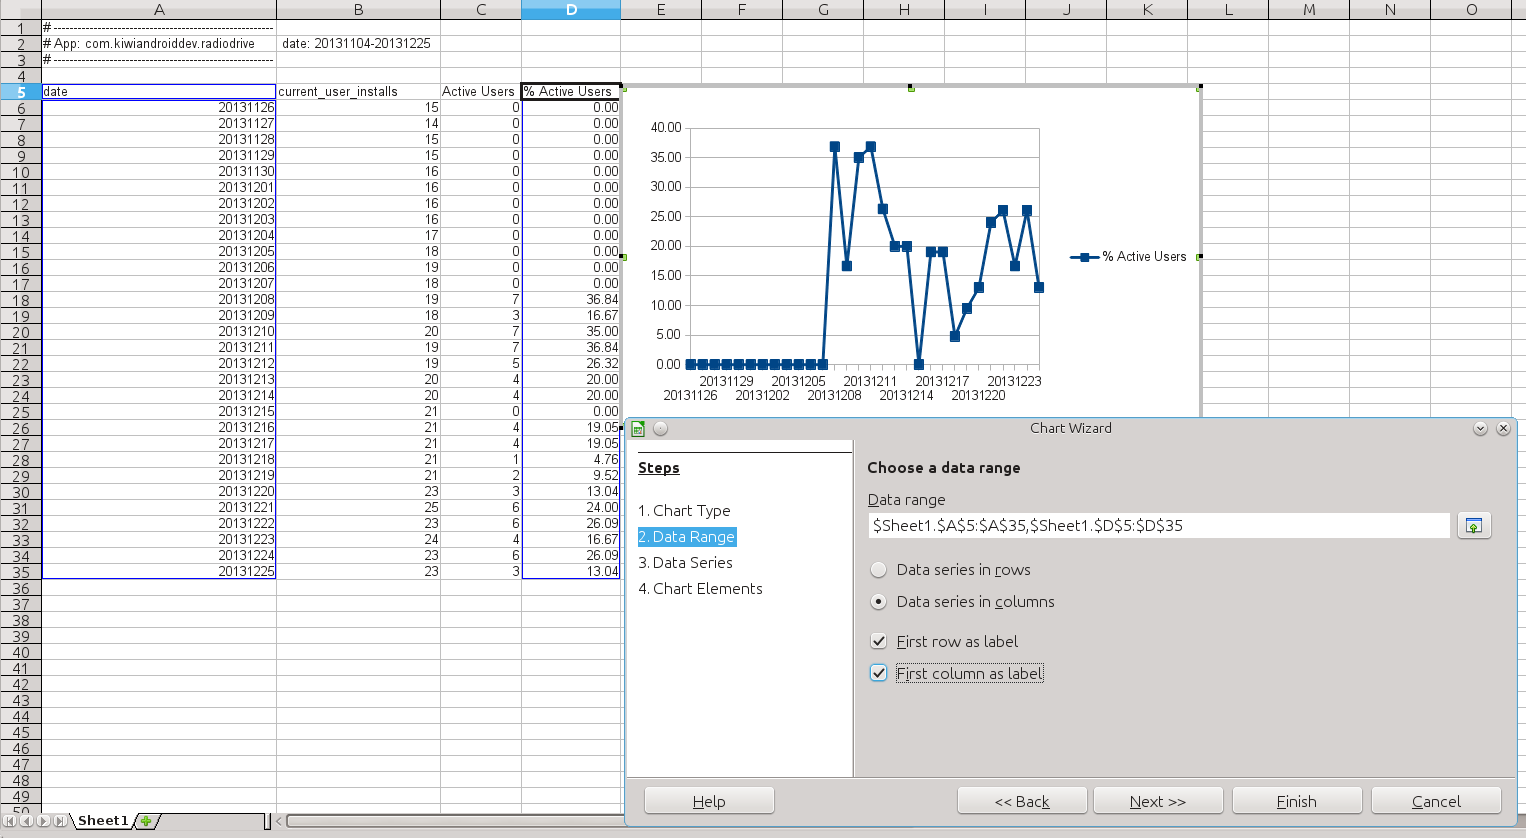
So far so good, we have a graph showing the percentage of active users each day.
But there’s a problem. Say you release an update for your app that is a total flop. Users start to uninstall your app in droves, except for a small segment of your dedicated fans. In this case, the percentage of active users may actually go up, as your botched update eliminates all but your most loyal users.
If you keep an eye on your other statistics such as daily uninstalls and number of active users (as well as monitoring actual user feedback), you would (hopefully) pick up this kind of scenario. However it’d be nice to be able to see this situation occurring in the same graph.
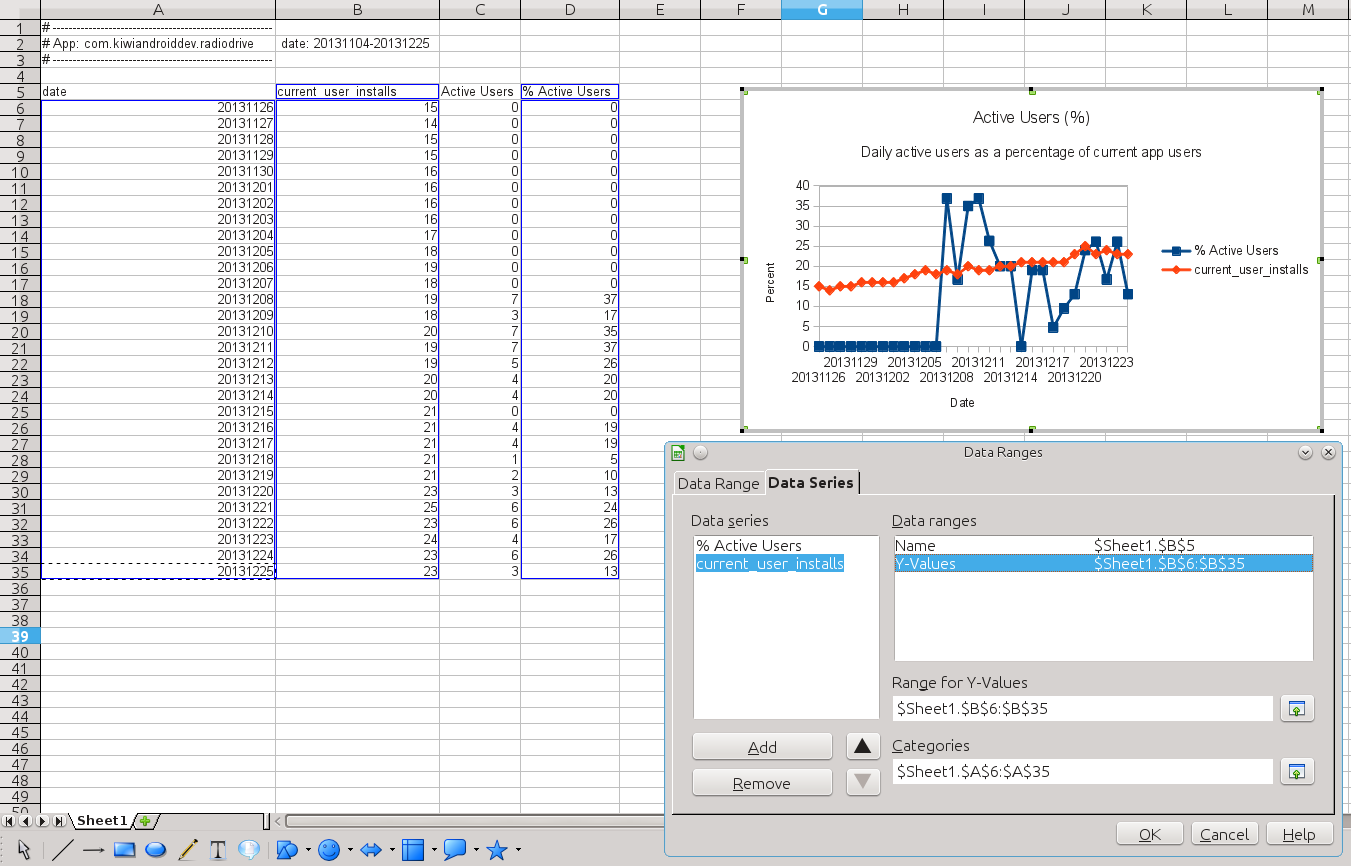
To do this, you can simply plot current user installs or number of active users on the same axes. That way, you’ll know something is up if either of them start trending downward.
Here I’ve plotted current user installs on a secondary Y axis:
The final graph (after adjusting the percentage scale to prevent overlap):
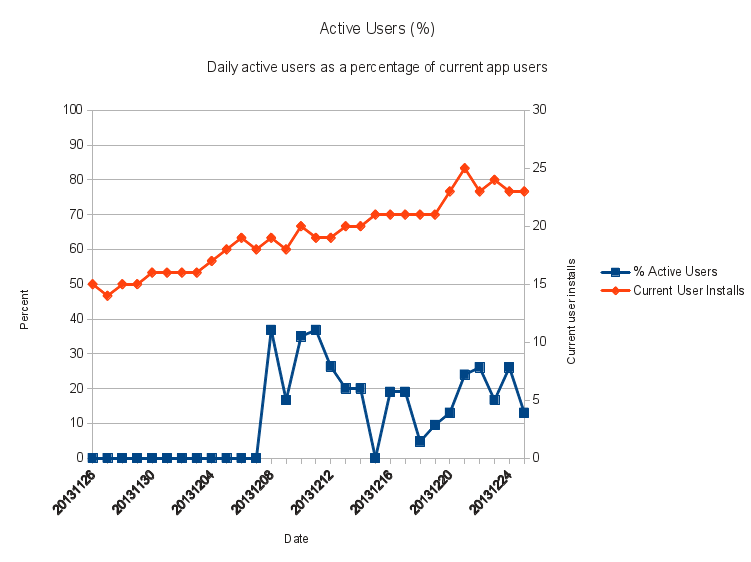
(In case you’re wondering, the lack of active user data until the 8th Dec is due to Google Analytics not being in the app until then!)
Extra credit: add a 3 or 5 day moving average trend line to % Active Users to smooth out fluctuations (having a larger sample size helps with this also).
What core metrics do you measure for your app and what tools do you use to measure them?